
This article is not a case study and not a product report. It's based on aggregated and anonymized CRM data from tree service companies using Arbostar over the full year of 2025. The goal is simple: to look at common financial patterns, not individual success stories or tools.
All numbers are combined across many businesses, so no single company, team, or workflow is being judged. The data helps reveal trends that show up again and again across the industry, no matter where a company is located or how big it is.
Here's the uncomfortable truth: most money is lost before crews even show up on site. It's not broken equipment or sloppy work – it's what happens earlier, during estimating, planning, scheduling, and coordinating internally. When these early steps get rushed or slip through the cracks, money quietly disappears.
By the time the crew even shows up on site, some of the potential profit has already slipped away. Getting a handle on these pre-job losses is what really shows how a tree service business is performing under the hood.
What This Research Is – and What It Is Not
This research is designed to clarify its scope from the start. To avoid misinterpretation, it is important to distinguish what the analysis covers and what it deliberately leaves out. The table below outlines these boundaries clearly.
| This research is | This research is not |
|---|---|
| A snapshot of current market behavior | A before-and-after study |
| Based on aggregated, anonymized operational data | A comparison between individual companies or clients |
| Focused on recurring industry-wide patterns | A ranking or performance benchmark |
| Concentrated on pre-execution processes | An analysis of field work or crew productivity |
| A structural view of how revenue erodes | A product review or implementation report |
The intent is not to explain how companies should operate, but to show where revenue typically breaks down in practice – often well before any work is performed on site.
Where Revenue Is Lost Before Work Begins
Before any crew is dispatched or equipment is loaded, a significant portion of potential revenue is already filtered out. The losses at this stage are structural, repeatable, and often invisible in day-to-day operations.
Estimate → Job Conversion
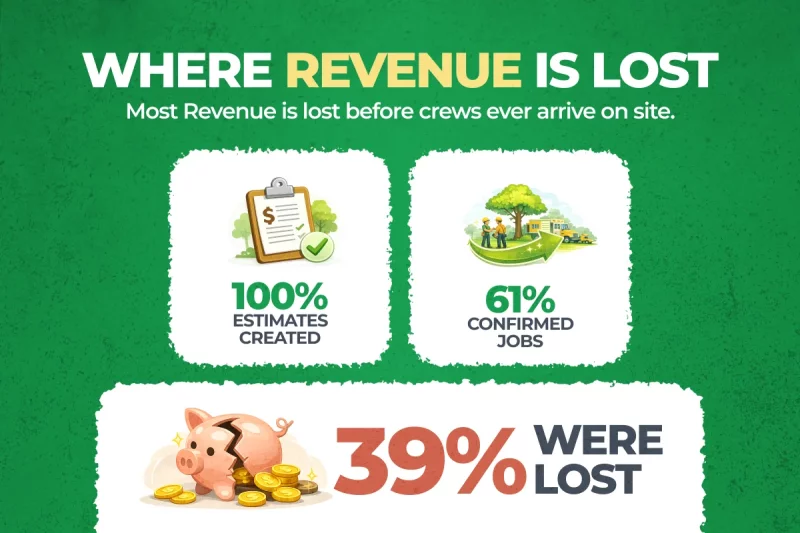
Across the aggregated data, the average estimate-to-job conversion rate sits at 61%. That means about 39% of issued estimates never turn into confirmed work. The gap matters because estimates take time, labor, and attention, so each unconverted estimate is effort spent with no real return.
The Revenue Gap Between Estimated and Confirmed Work
The data shows a consistent gap between total estimated revenue and total confirmed revenue across the sample. This leaves a substantial potential revenue gap, highlighting structural pre-execution losses rather than accounting "losses".
Importantly, this is not an accounting loss and not a reporting error. It is revenue that was anticipated but never materialized. Because it never reaches execution, it often escapes scrutiny – yet it directly shapes how tree service businesses perceive demand, growth, and financial performance.
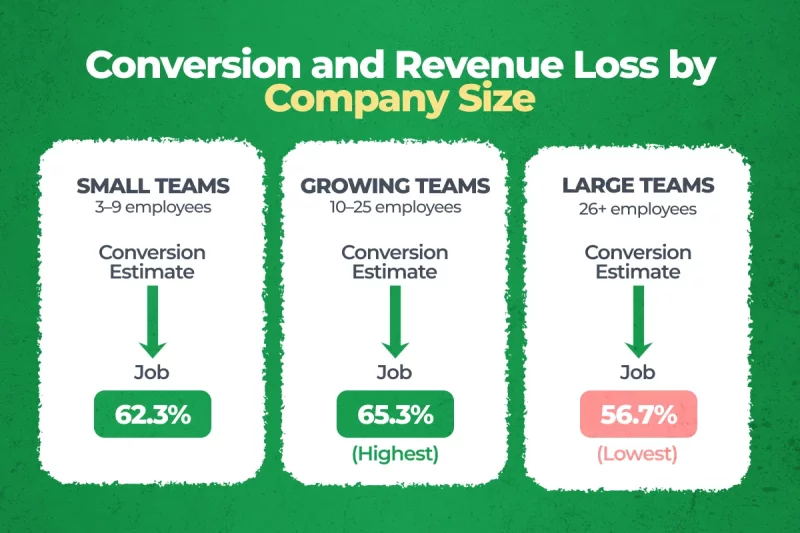
Conversion and Revenue Loss by Company Size
| Company size (active users) | Conversion estimate → job |
|---|---|
| Small (3–9 employees) | 62.3% |
| Growing (10–25 employees) | 65.3% (highest) |
| Large (26+ employees) | 56.7% (lowest) |
A clear pattern emerges: as companies grow, conversion tends to decrease, but the absolute unrealized revenue increases.
Where Work Gets Stuck Instead of Moving Forward
Not all lost revenue comes from clear rejection or explicit decline. A meaningful share disappears more quietly, when work stalls inside the process and never reaches a definitive outcome.
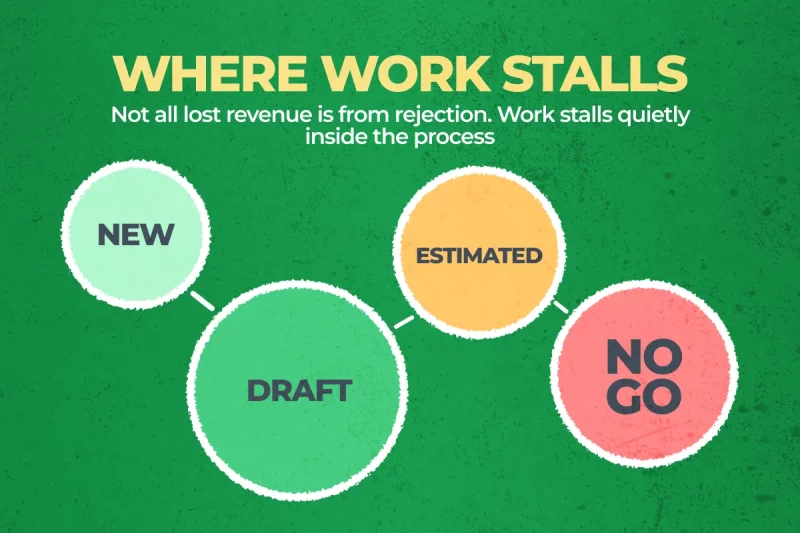
Lead Status Distribution
At a high level, incoming leads tend to spread across several recurring statuses: New, Draft, Estimated, and No Go. The data show that a portion of revenue is "lost" simply because work stalls in intermediate statuses rather than being actively declined. This is directional insight, meant to illustrate that not all gaps come from explicit rejections.
A noticeable portion of leads remains in intermediate states such as Draft or Estimated for extended periods. These are not leads that were actively rejected, nor ones that clearly failed to qualify. Instead, they sit unresolved – neither moving forward nor being closed out.
This suggests that part of the revenue loss is not driven by customers saying no, but by processes that slow down or lose momentum internally. Work does not stop because of a decision; it pauses because no decision is made.
It is important to treat this as a directional insight rather than a precise statistical breakdown. The exact proportions vary by company and context, but the pattern itself appears consistently: revenue often fades not through refusal, but through inactivity.
How These Losses Change as Companies Grow
Revenue leakage before execution does not remain static as companies scale. Instead, the nature and visibility of these losses shift as team size, workload, and internal complexity increase.
Company Size Segmentation
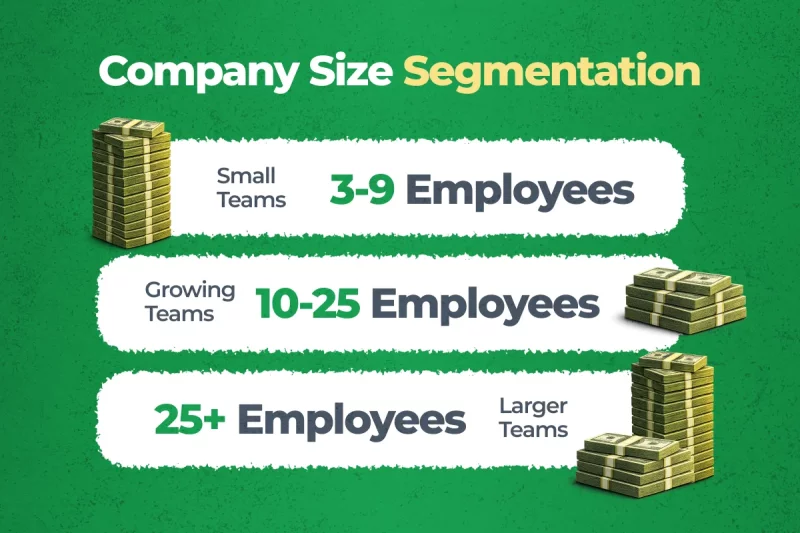
For this analysis, companies are grouped by team size to reflect meaningful operational differences rather than revenue tiers.
Small teams include businesses with 3–10 employees, where responsibilities are often shared and decisions are centralized. Growing teams consist of 10–25 employees, typically marked by role separation and higher job volume. Where relevant, larger teams of 25+ employees are referenced to illustrate scaling effects.
This segmentation helps isolate one key dynamic: as companies grow, revenue losses do not disappear. They scale. What was once manageable friction in a small operation can become a structural drag as volume increases and processes multiply.
Conversion and Revenue Loss by Company Size
Across segments, conversion rates tend to shift as team size increases. Small teams often show higher estimate-to-job conversion, driven by direct communication and faster decision cycles. As companies grow, conversion becomes more variable and, in many cases, declines.
At the same time, the gap between estimated and confirmed revenue widens. Growing teams issue more estimates, project larger totals, and manage more parallel opportunities. As a result, the absolute amount of unrealized revenue increases – even when demand remains strong.
The key takeaway is that these losses are not primarily caused by a lack of incoming work. They emerge from added layers of coordination, handoffs, and internal dependencies. As processes become more complex, revenue leakage becomes harder to spot and easier to accept as normal – despite its growing financial impact.
What These Numbers Say About the Industry
Taken together, these figures point to a consistent industry-wide pattern. Most tree service companies do not directly see these losses, because they do not appear in reports tied to completed jobs, crew hours, or field performance.
The revenue erosion happens earlier, inside the funnel – between first contact, estimation, and confirmation. Because this stage sits upstream from execution, its impact is often indirect and difficult to trace back to a single cause.
As a result, businesses may appear busy, in demand, and operationally active, while a significant share of potential revenue quietly falls away. The numbers suggest that what shapes financial outcomes in the industry is not only how work is performed, but how much work never makes it that far.
This is not a statement about poor management or weak demand. It is an observation about structural visibility: the largest losses tend to occur where they are least likely to be measured, discussed, or challenged.

This Research as a Baseline
This study captures a snapshot of the industry as it operates today – a baseline of current patterns, revenue dynamics, and pre-execution losses. It reflects the structural realities of tree service businesses at a specific point in time, without implying improvement or decline.
By establishing this reference point, future analyses can measure change, track trends, and compare how operational processes evolve over months or years. Returning to these metrics later will allow the industry to observe shifts in conversion, revenue gaps, and workflow efficiency with a clear frame of reference.
For now, this research simply presents the current state, highlighting patterns that persist across company sizes and operational models. It is an objective view of where revenue is lost before work begins and how these dynamics define the financial landscape of the industry.